Know When Places Are Busy
Public venue weekly forecasts and visitor patterns























Foot traffic data that improves decisions
Turn “where” into “where + when” for better recommendations, planning, and operations.
Built for developers & city builders
Combine weekly forecasts, venue search, and flexible filters to power location-aware experiences.
Venue visitor patterns
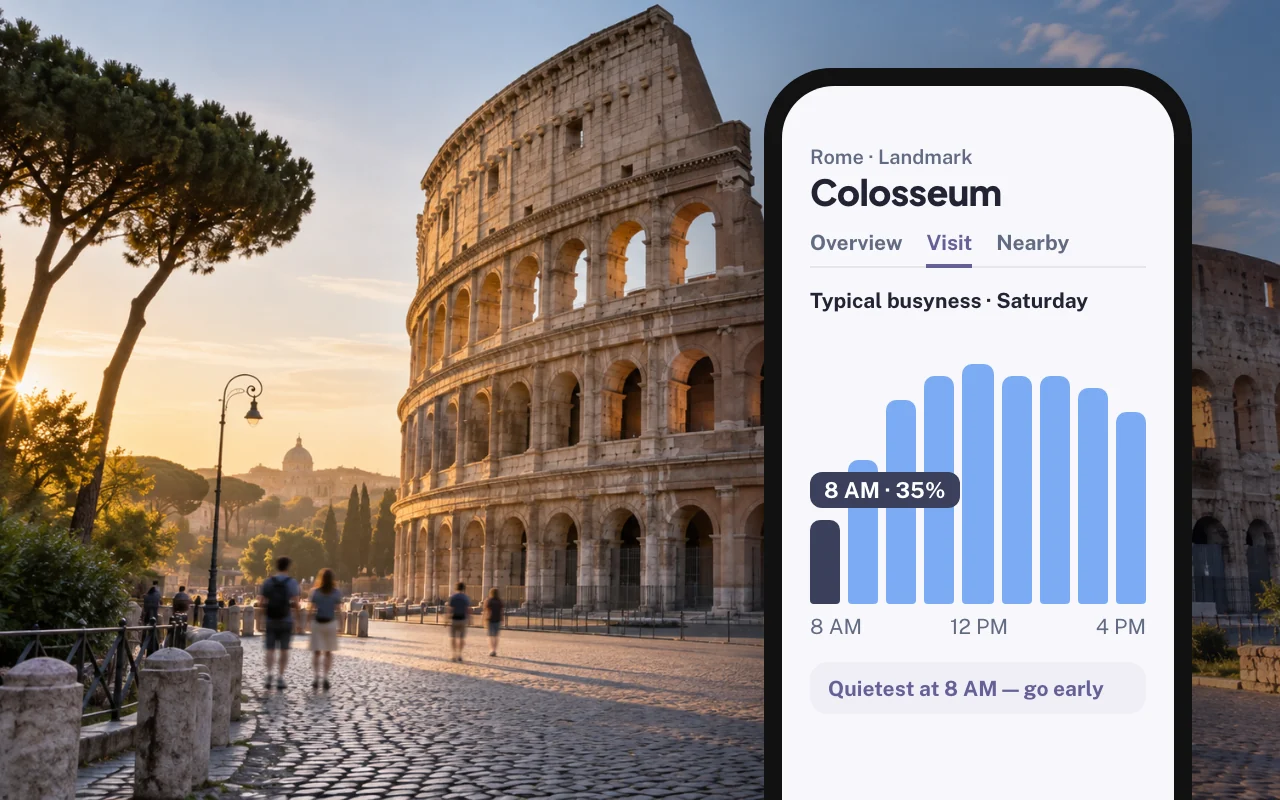
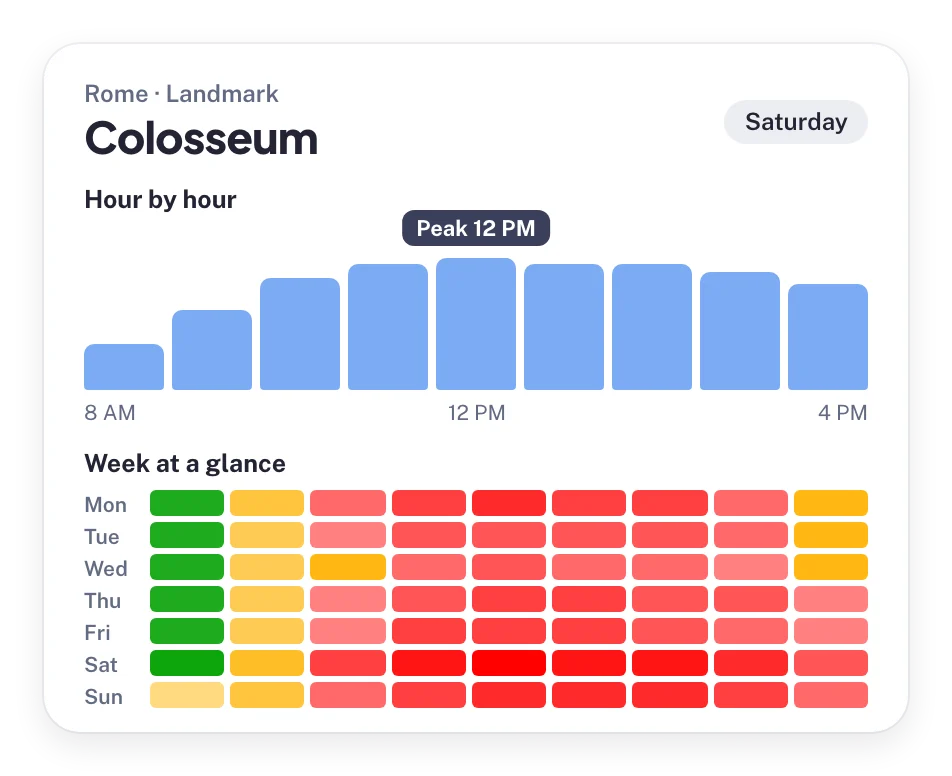
- Hourly Predictions: Get relative foot traffic percentages (0–100%) for every hour of the week.
- Peak Analysis: Automatically identify daily high points, quietest hours, and peak intensity.
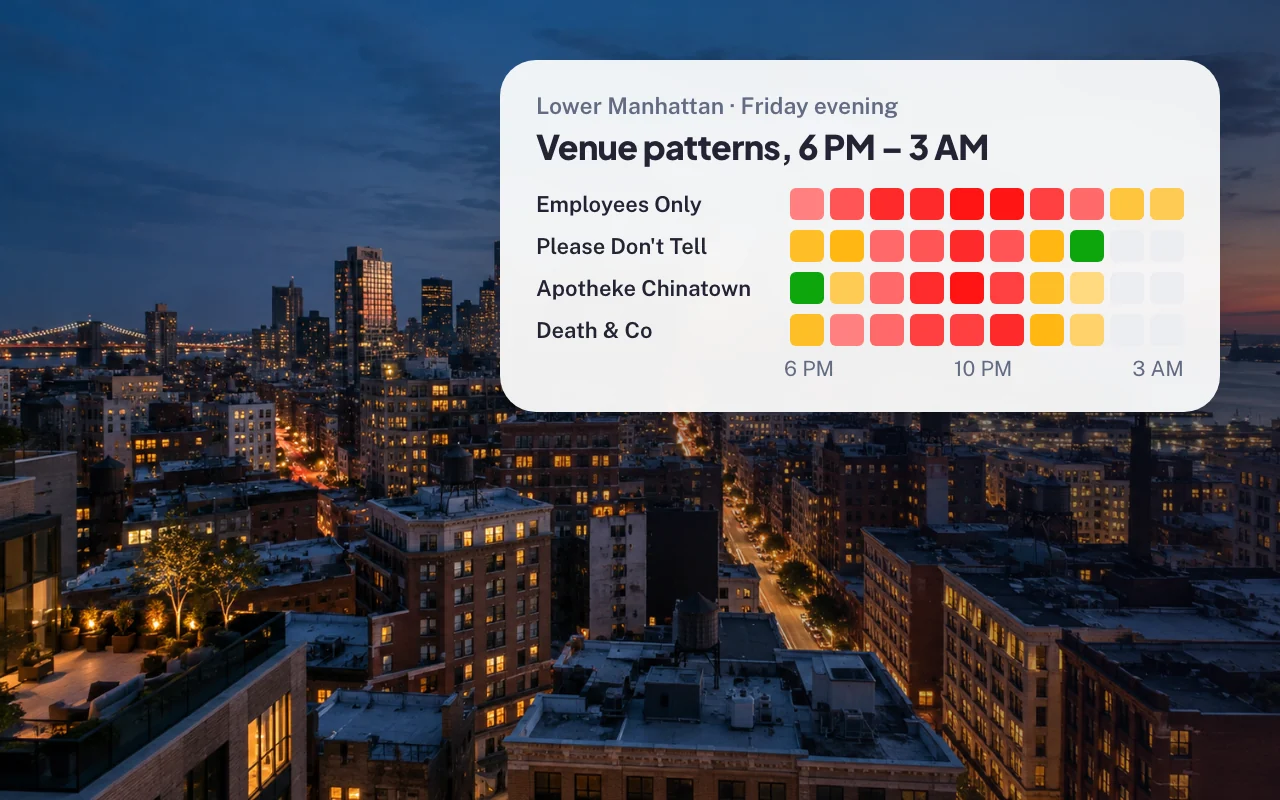
- Visitor Flow: Use "Surge analysis" to identify typical arrival and departure surges at a venue.
Venue Search
Find and add venues worldwide with natural-language queries like “McDonald’s in Manhattan” or “Brunch places in Paris”.
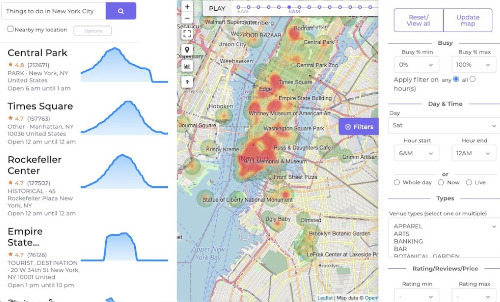
Open the city guide demo
Discover the Pulse of the City
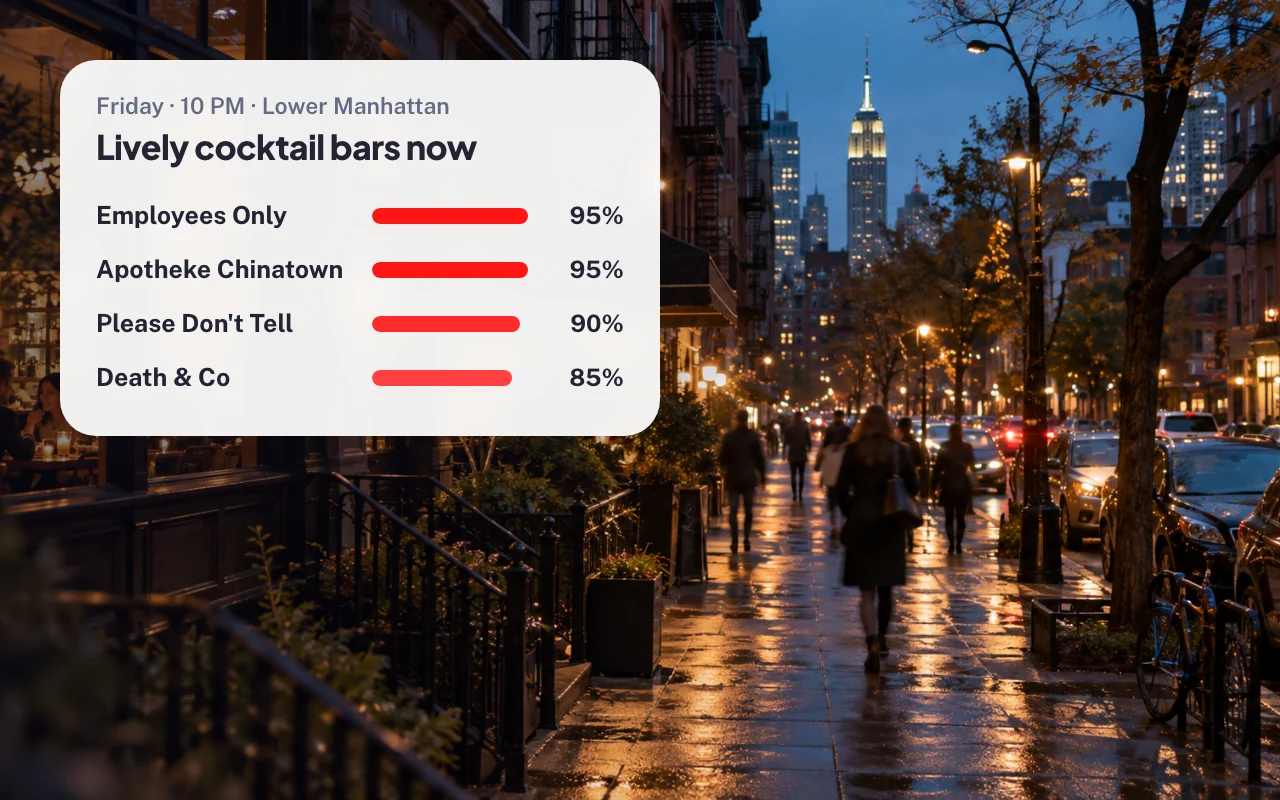
Don’t just find a venue—find the right vibe at the right time. Use the Venue Filter to spot predicted hotspots, identify quiet gems, and compare places for any day and hour of the week.
- Time-travel filtering: “Friday at 10 PM”
- Venue categories: BREWERY, MUSEUM, SUPERMARKET, and more.
- Granular filters: coordinates, rating, reviews, dwell time, and more.
Developers
One API call away to make your app smarter
Transform how users interact with the real world.
Don’t just search for a location—find the right location.
Use our advanced filtering to programmatically find venues based on:
- foot traffic intensity
- geography
- day, hour
- reviews, ratings
- business types
- dwell time (visitor duration)
Combine these filters with weekly forecasts to answer questions like
“Which bars are usually busy on Friday evening?” or “When is the gym quietest?”—all in a single API
call.
/forecasts?venue_name=McDonalds&venue_address=Ocean+Ave+San+Francisco
Response:
{
  "foot_traffic_percentage": [
    5, 20, 35, 55, 70, 85, 90, 90,
    85, 80, 80, 85, 85, 80, 65, 50,
    40, 35, 30, 20, 5, 0, 5, 5
  ],
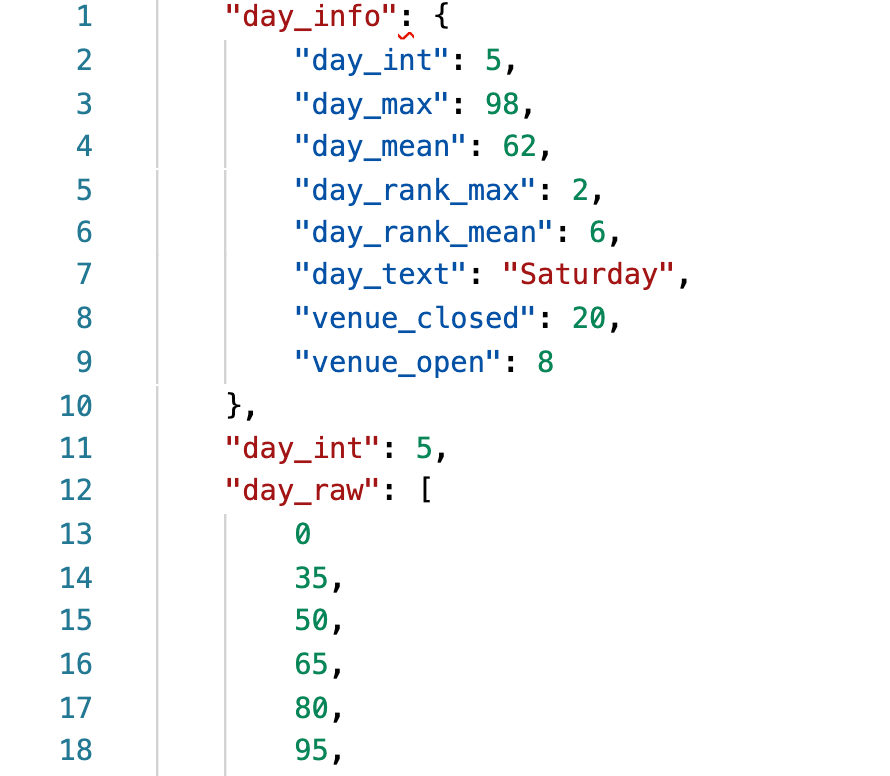
  "day_info": {
    "day_text": "Friday",
    "day_mean": 56,
    "day_max": 89
  },
  "busy_hours": [10, 11, 12, 13, 14, 15, 16, 17, 18, 19, 20],
  "quiet_hours": [1, 2, 3, 6, 7],
  "peak_hours": [
    {
      "peak_start": 9,
      "peak_max": 12,
      "peak_end": 21,
      "peak_intensity": 4
    }
  ],
  "venue_info": {
    "venue_name": "McDonald's",
    "venue_address": "1201 Ocean Ave San Francisco, CA 94112 United States",
  }
}
venues/filter?busy_min=50&types=BAR&day_int=4&lat=37.7882488&lng=-122.4370937&radius=10000&reviews_min=500&rating_min=4
Response:
{
"venues": [
{
"venue_name": "Charmaine's Rooftop Bar & Lounge",
"venue_address": "1100 Market St San Francisco, CA 94102 United States",
"venue_type": "BAR",
"rating": 4.4,
"reviews": 1194,
"foot_traffic_percentage": [0,0,0,0,0,0,0,0,0,0,35,50,65,80,85,80,70,50,0,0,0,0,0,0]
},
{ "...": "Other venues hidden, see docs" }
],
"venues_n": 231,
"window": { "day_window": "Friday 6AM until Saturday 5AM" },
"status": "OK"
}/forecasts/peaks?venue_name=Times+Square&venue_address=Manhattan,NY,USA
Response:
{
"analysis": {
"peak_hours": [
{
"peak_start_12h": "6PM",
"peak_max_12h": "9PM",
"peak_start_in": "1 hour and 45 minutes",
"peak_max_in": "4 hour and 45 minutes",
"peak_intensity": 5
}
]
},
"status": "OK"
}/venues/search?q=popular+museums+in+London&num=20
Response:
[
{
"venue_name": "British Museum",
"venue_address": "Great Russell St, London WC1B 3DG, United Kingdom",
"venue_id": "ven_513871...",
"venue_foot_traffic_forecast": [
{
"day_info": { "day_text": "Friday", "day_max": 92 },
"day_raw": [0,0,0,0,10,25,45,65,85,92,88,75,60,40,20,0,0,0,0,0,0,0,0,0]
}
]
},
{
"venue_name": "Natural History Museum",
"venue_address": "Cromwell Rd, South Kensington, London SW7 5BD",
"venue_id": "ven_624982...",
"venue_foot_traffic_forecast": "..."
}
]Find the place. Understand the hour. Build it in.
Filter an area, read a venue’s hourly pattern, and use the same numbers in your app.
Find the venue
Busy cocktail bars in Lower Manhattan, Friday at 10 PM.
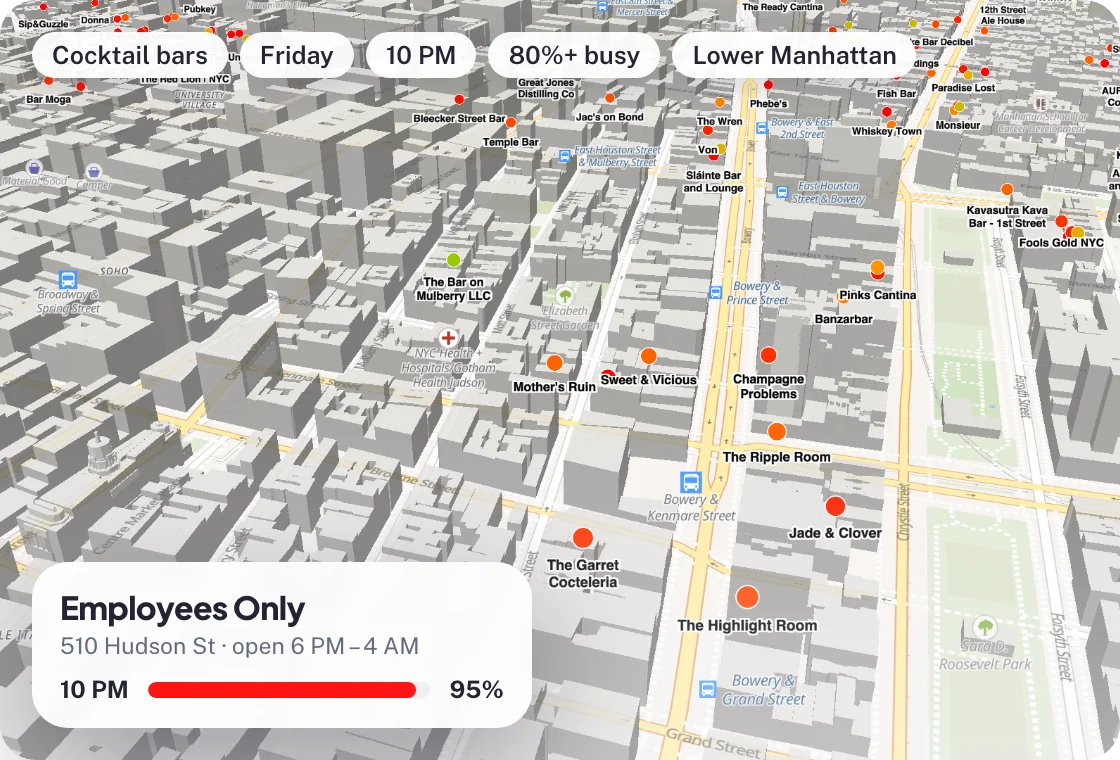
Read its pattern
Employees Only · Friday forecast
100% = this venue’s busiest forecasted hour of the week.
Use the data
The same values in the API response
{
  "venue_name": "Employees Only",
  "day_info": { "day_text": "Friday" },
  "day_raw": [
    0, 0, 0, 0, 0, 0,
    0, 0, 0, 0, 0, 0,
    70, 80, 90, 90, 95, 95,
    85, 75, 55, 50, 0, 0
  ]
}24 hourly values, starting at 6 AM.
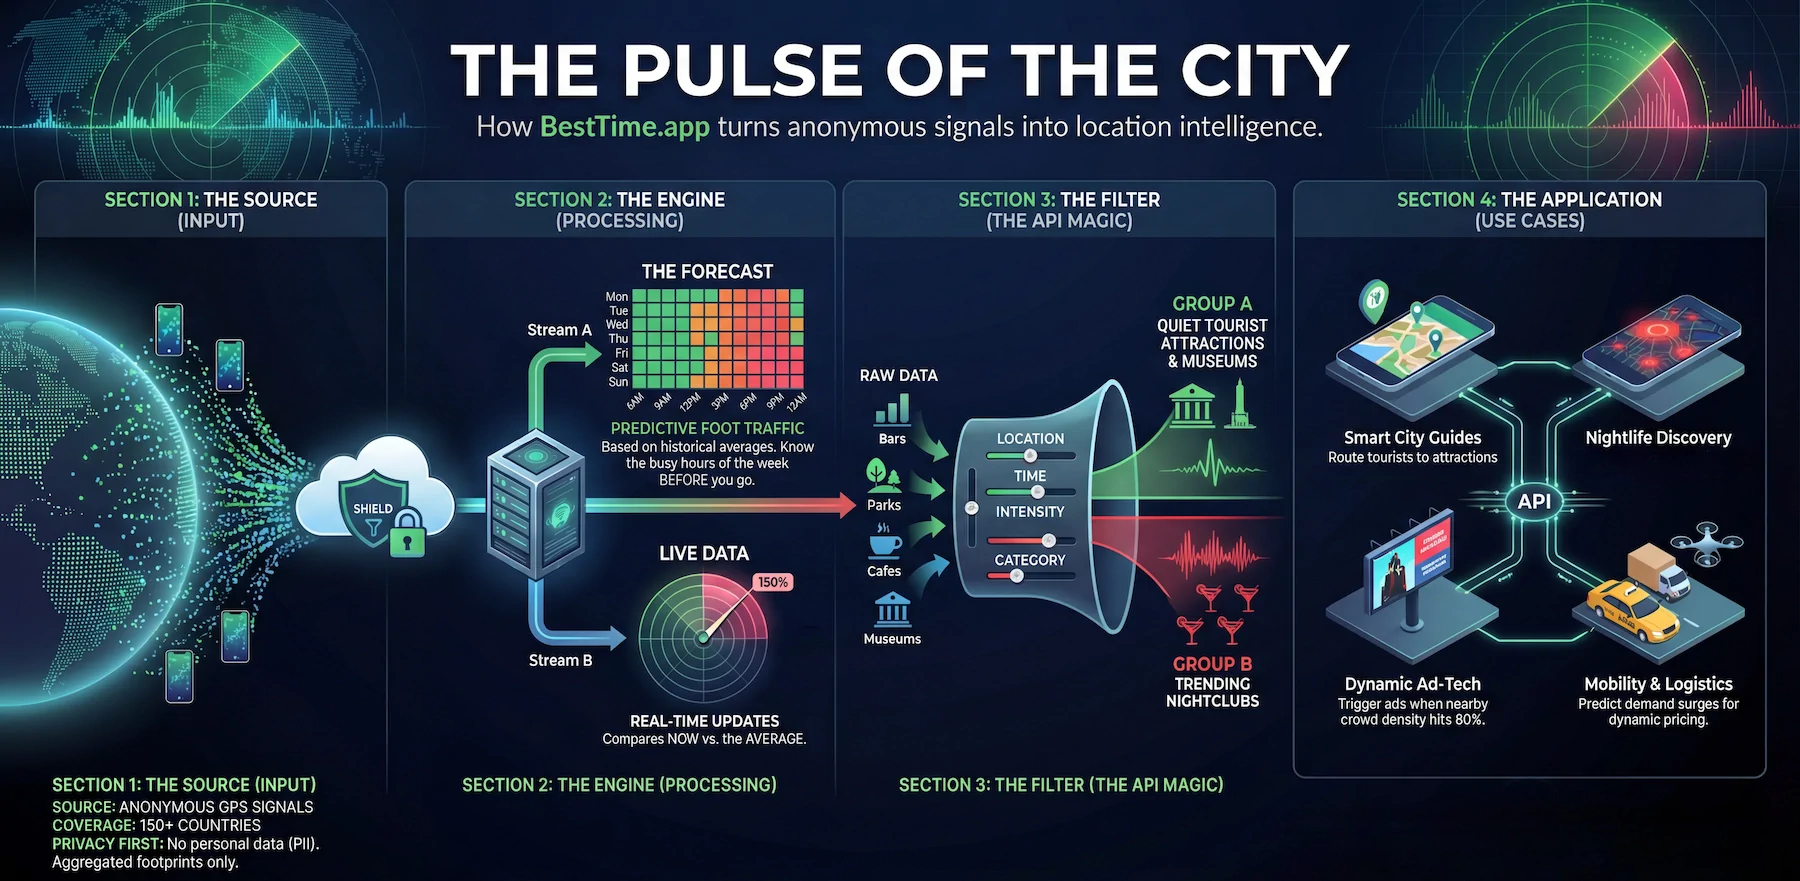
Weekly forecasts, normalized 0–100
BestTime provides hourly foot traffic forecasts for each day of the week, helping you compare venues and plan around their usual visitor patterns.
- Foot Traffic Forecasts are relative percentages (0–100%), wherein 100% indicates the peak of the week.
- Compare predicted peaks and quiet hours across the week.
- Filters help you find venues by predicted busyness, location, day/time, ratings, reviews, and venue category.
Common workflows
See BestTime in action
BestTime in 47 seconds, plus a closer look at the platform and Radar heatmaps.
BestTime in 47 seconds
Weekly forecasts, venue search, the Venue Filter API and AI agents.
Platform overview
Weekly forecasts, venue filtering, and venue insights in one workflow.
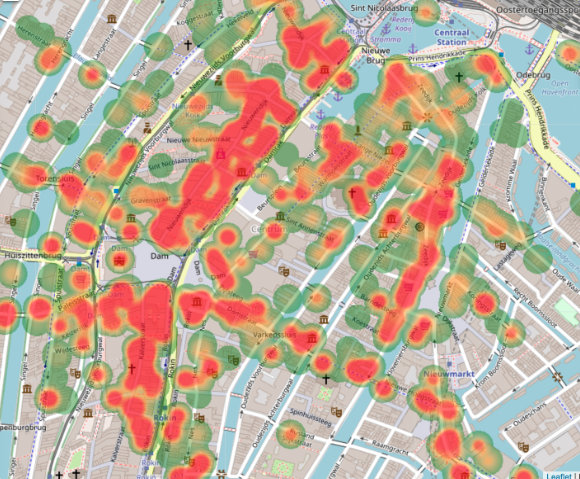
Radar heatmaps
Find busy/quiet areas and filter venues by time, day, type, and more.
Start building in minutes
Create a free test account, explore the tools, then integrate the API.
Popular use cases
Learn by example
Quick guides to get value from BestTime tools and the API.
Frequently asked questions
Quick answers to common questions about coverage, weekly forecasts, and venue filtering.
Start predicting foot traffic today
Join teams building smarter city guides, travel apps, staffing models, and analytics dashboards.
Get Free API Key