 BestTime
Quick answer
Short answer: use a venue busyness forecast. It learns a venue's usual pattern for every hour of the week from anonymized, aggregated phone location data, combined with other real-world signals such as weather, events and holidays. With the BestTime API you send a venue's name and address once, get a 0-100 forecast for all 168 hours of the week, then read the day and hour you care about.
A value of 100 is the venue's own busiest hour of a normal week. It is not a share of capacity and not a head count.
Start free See the API exampleForecast a venue for a given hour, step by step
- Identify the venue. A name and address are enough, for example "Colosseum, Piazza del Colosseo, Rome".
- Create the forecast. You get busyness for every hour of every day of the week, plus a venue ID to use in later requests.
- Pick the day and hour. Days run from 6 AM to 5 AM the next morning, so 1 AM on a Saturday night counts as Friday night.
- Read the value. 0-100, relative to the venue's busiest hour, with a label such as below average, average or above average.
- Plan around it. Pick the quietest or busiest hour that fits, or compare the same hour across days.
What goes into a busyness forecast
| Input | What it adds |
|---|---|
| Anonymized, aggregated phone location data | The venue's usual rhythm: how busy it tends to be at each hour of each weekday. The data comes from users who opted in through third-party mobile applications and SDK partners. |
| Weather | Rain, heat and cold change where people go, for example parks against museums. |
| Events | Concerts, games and festivals bring crowds to a venue and the streets around it. |
| Holidays | Public and school holidays shift the normal weekday and weekend pattern. |
The output is busyness per venue and hour. The API does not expose personal identifiers, device IDs, raw location traces or visitor counts.
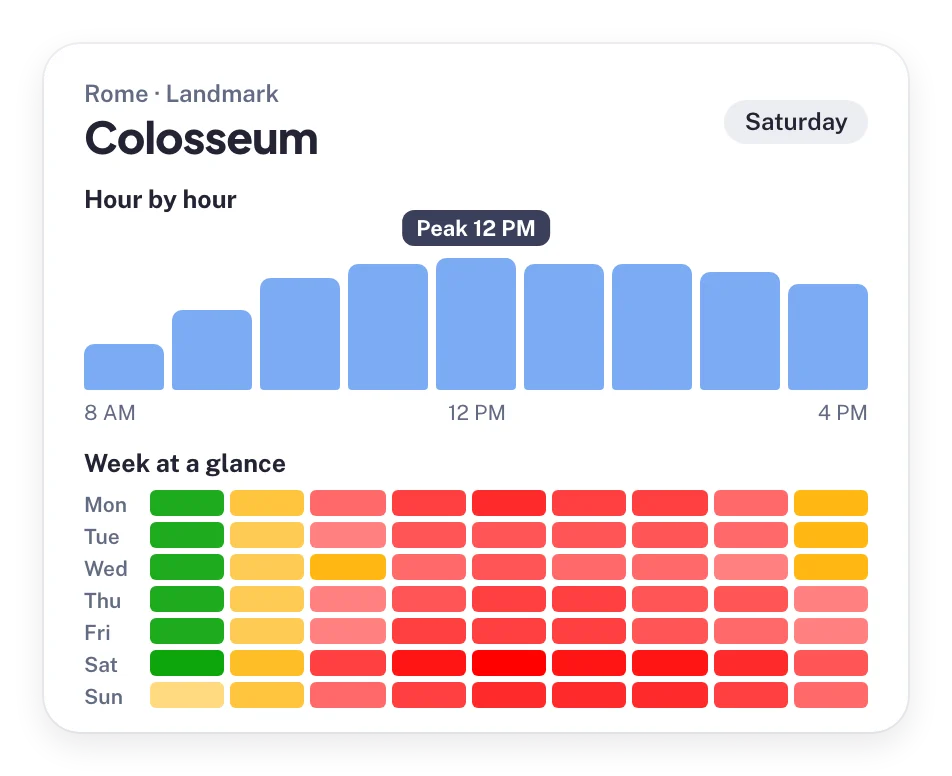
Why the scale is 0-100, relative to the venue's own peak
Each venue is measured against itself. 100 is the busiest hour of that venue's normal week, and 50 means about half as busy as that peak. 0 means the venue is closed or nearly empty.
- Not capacity. 100 does not mean the venue is full. It means this is as busy as the venue usually gets.
- Not a head count. 80 at a small cafe and 80 at a stadium are very different numbers of people. Both mean "close to its usual peak".
- Easy to compare in time. You can see at a glance when a venue is busy or quiet, and rank hours or days for the same venue.
A relative scale works for any venue type and size without knowing its capacity, and it answers the question most people ask: when is it busy, and when is it quiet? Each hour also gets a label, from below average to above average, compared with the venue's weekly average.
How to use the forecast
| Question | What to read from the forecast |
|---|---|
| When should I go to avoid crowds? | The quietest open hours on the day you plan to visit. |
| When will this bar be lively? | The peak hours on Friday or Saturday night. |
| Which day is quietest? | Compare the same hour across the seven days of the week. |
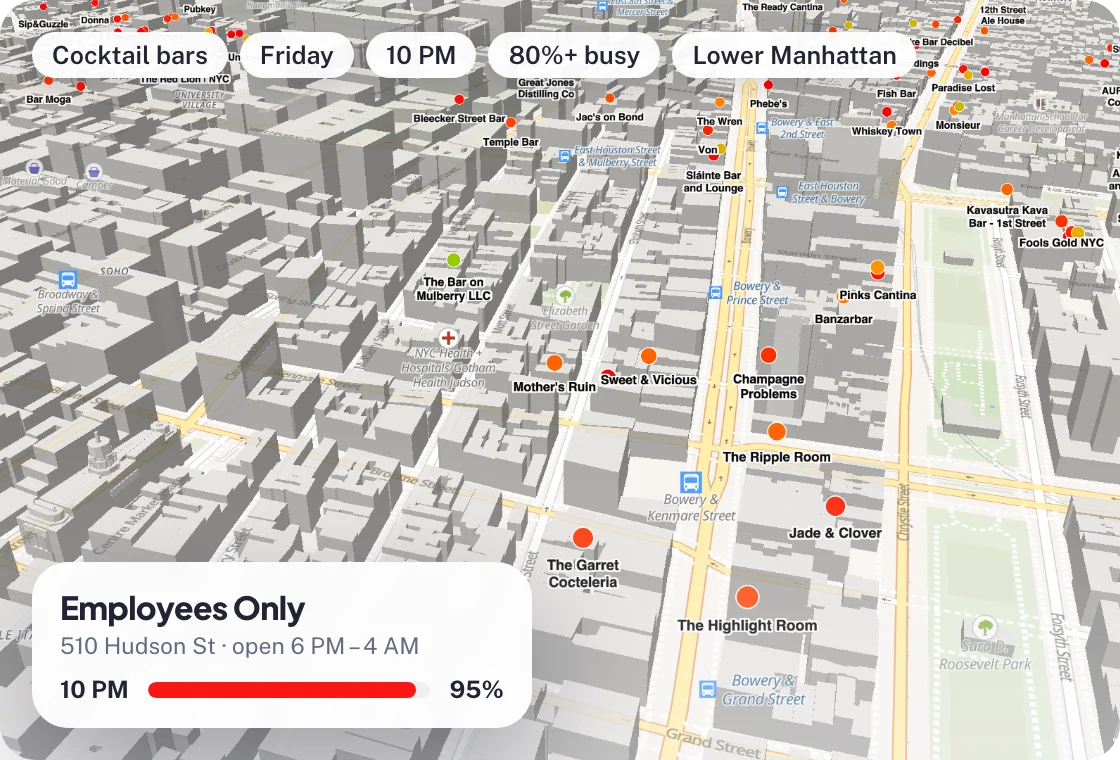
| Which venues nearby fit my plan? | Filter many venues by predicted busyness for a day and hour with the Venue Filter API. |
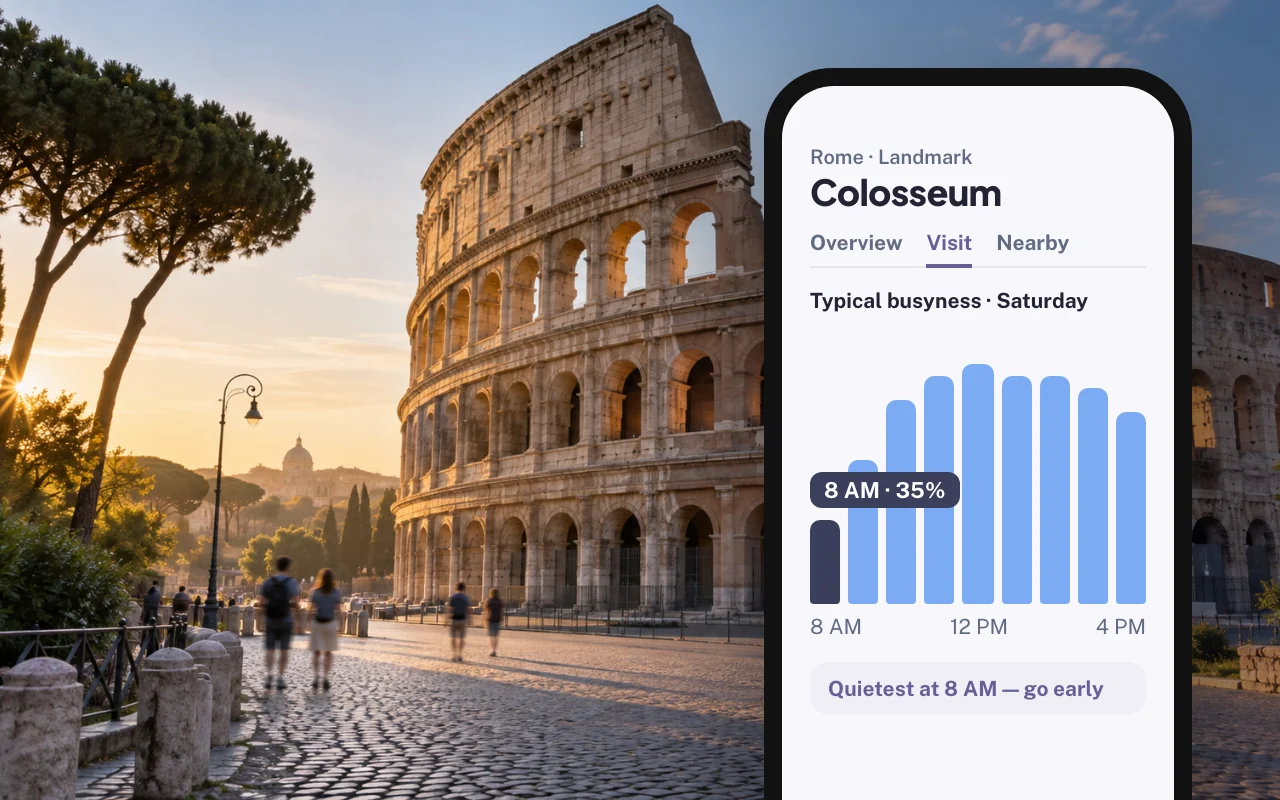
API example: forecast a venue, then read one hour
First create the forecast with your private API key. The first forecast for a venue costs 2 credits.
curl -X POST "https://besttime.app/api/v1/forecasts?\
api_key_private=YOUR_PRIVATE_KEY&\
venue_name=Colosseum&\
venue_address=Piazza+del+Colosseo+Rome+Italy"
The response contains the forecast for every day of the week and a venue_id in venue_info. Then read one day and hour with your public key. day_int runs from 0 for Monday to 6 for Sunday, and hour from 0 to 23.
curl "https://besttime.app/api/v1/forecasts/hour/raw?\
api_key_public=YOUR_PUBLIC_KEY&\
venue_id=VENUE_ID&\
day_int=5&\
hour=14"
Response, trimmed, with example values:
{
  "status": "OK",
  "analysis": {
    "hour_raw": 85,
    "hour_analysis": {
      "hour": 14,
      "intensity_txt": "Above average",
      "intensity_nr": 1
    }
  }
}
hour_raw is the 0-100 busyness for Saturday at 2 PM. To find which venues will be busy or quiet at an hour, rather than checking one venue, use the Venue Filter API. Full request and response fields are in the BestTime documentation.
Limits to keep in mind
- Relative, not counts. If you need how many people came, use a door counter at your own venue or a visit-count provider such as Placer.ai or Advan Research.
- Coverage depends on signal. Busy public venues such as bars, restaurants, stores, museums and attractions are covered best. Small or rarely visited places may have no forecast.
- Forecasts show the usual pattern. A last-minute closure or an unplanned crowd is not in a forecast made in advance.
- Public venues only. Forecasts are not meant for private workplaces, homes or staffing plans.
Other ways to estimate how busy a place will be
| Approach | What it tells you | Fits when |
|---|---|---|
| Door or camera counter | Exact counts at doors you own and fit with sensors. | You run the venue and want real counts. |
| Visit-count providers: Placer.ai, Advan Research, Pine59, Veraset | Estimated visits to stores, malls and districts, sold by quote. | Site selection, chain tracking and market reports. |
| Busyness forecast API: BestTime | Relative 0-100 busyness for every hour of the week, venue filters. | An app, guide or tool shows when venues are busy or quiet. Start free. |
See the foot traffic data providers compared, or where to get foot traffic data for free.
Questions about venue busyness forecasts
How can I forecast how crowded a venue will be at a given hour?
Use a venue busyness forecast. BestTime combines anonymized, aggregated phone location data with real-world signals such as weather, events and holidays, and returns how busy a venue is forecast to be for every hour of the week on a 0-100 scale. Send the venue name and address once, then read the day and hour you need.
What does a busyness of 60 mean?
About 60 percent as busy as the venue's busiest hour in a normal week. The scale is relative to each venue's own peak, so it does not tell you how many people are there.
Is busyness the same as capacity or the number of people?
No. 100 means the venue is as busy as it usually gets, not that it is full. 80 at a small cafe and 80 at a stadium are very different crowd sizes.
When is the best time to visit a venue to avoid crowds?
Look at the forecast for the day you plan to go and pick the lowest values during opening hours. Early mornings and weekday afternoons are often quietest, but every venue has its own pattern, which is why a forecast per venue helps.
Is there a popular times API to predict busy hours?
Yes. The BestTime API returns busy and quiet hours for public venues for every hour of the week. The forecasts are built from anonymized phone location data combined with real-world signals such as weather, events and holidays. You can test it for free.
Can I find all venues that will be busy at a certain hour?
Yes. The BestTime Venue Filter API returns venues in an area that match a predicted busyness range for a day and hour, filtered by category, ratings and more.
Forecast your first venue for free
Create a free account without a credit card, forecast a venue you know, and check its busy and quiet hours against what you see in real life.
Start free Read API docs