 BestTime
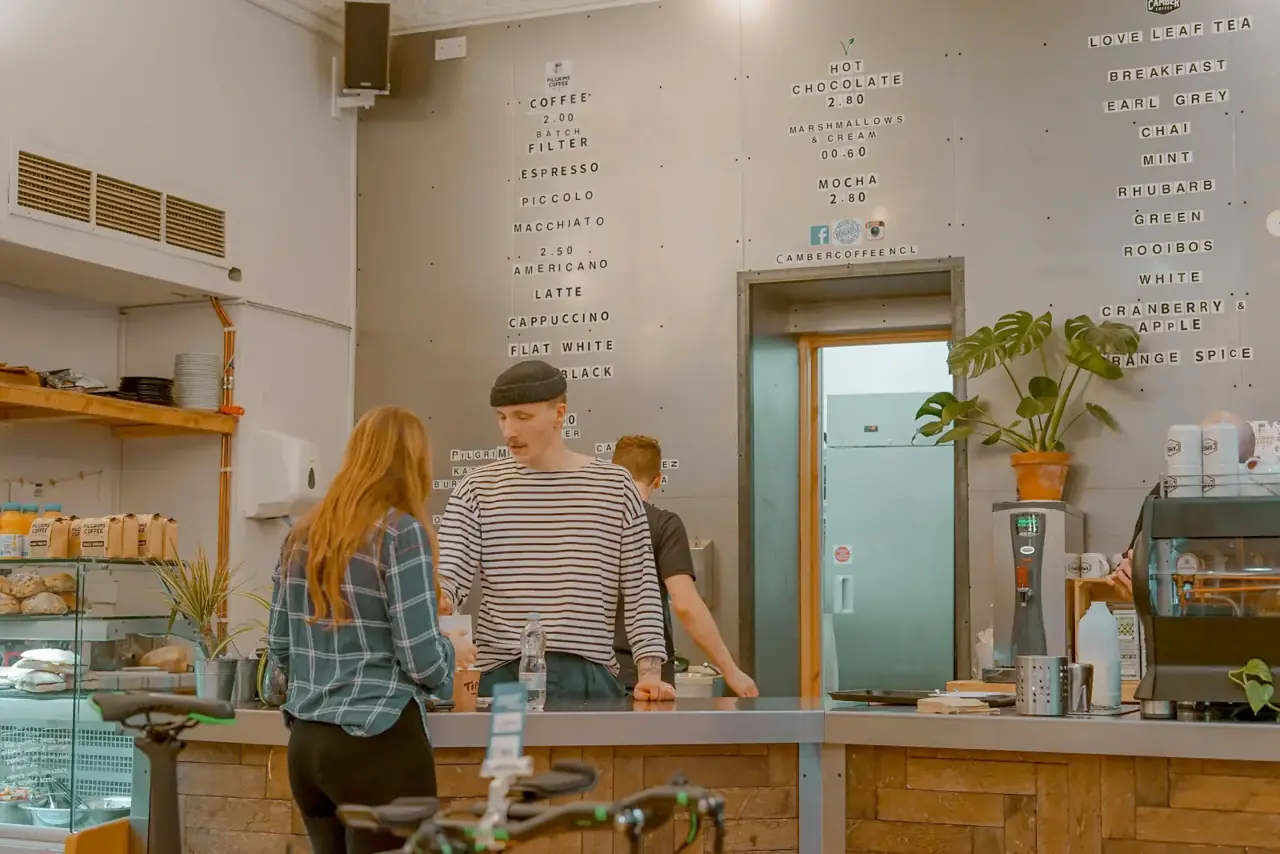
Local businesses use foot traffic data to answer one question: when are people here? With an hourly busyness forecast for your venue and the venues around you, you can staff for the rush, move maintenance to quiet hours, time promotions and set opening hours that match demand. Apps use the same data to tell their users when to go.
This guide covers seven use cases, one short section each: gyms, libraries, retail stores, venues with dynamic pricing, staffing agencies, building managers and dating or social apps. It ends with what the data can and cannot do.
What the data is
BestTime forecasts how busy a public venue is for each hour of the week on a scale from 0 to 100. The forecasts are built from anonymized, aggregated phone location data combined with other real-world signals such as weather, events and holidays. No sensors or installation are needed.
For each venue you get:
- Hourly busyness for Monday to Sunday, where 100 is the venue's own busiest hour of the week
- Peak hours, busy hours and quiet hours per day
- A ranking of the days of the week
- When most people arrive and when most leave
- Typical dwell time, where available
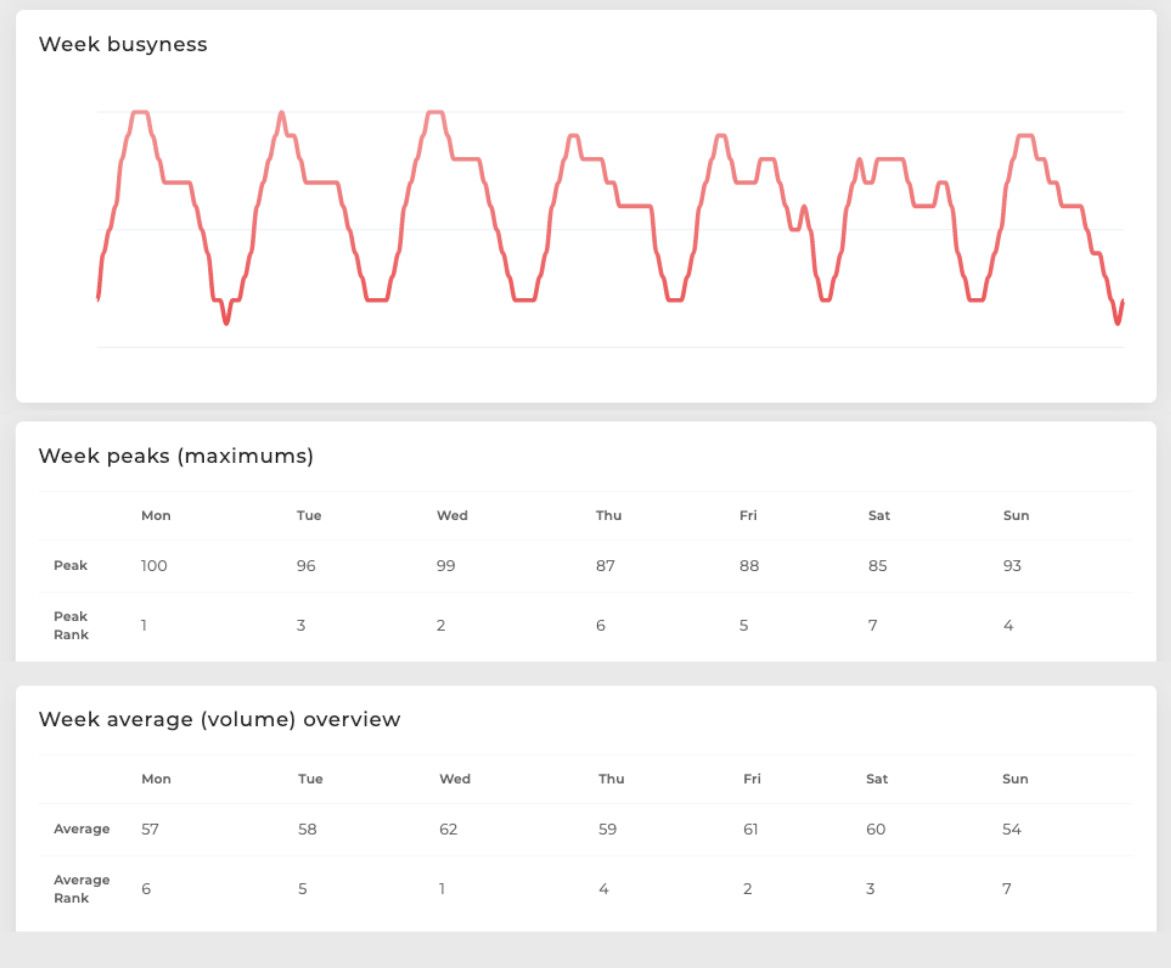 The week view for a sample venue. Monday has the highest single peak, but Wednesday has the highest average over the day.
Gyms and fitness studios
For members: nobody likes waiting for a squat rack. A gym's forecast shows the quiet windows, often mid-morning and mid-afternoon on weekdays, and the after-work peak from around 5 PM to 8 PM. A fitness app can show "quietest in the next three hours" next to each location.
For managers:
- Schedule floor staff and cleaners for the after-work peak.
- Plan equipment maintenance in the quietest weekday hours, so it disrupts the fewest members.
- Put new classes in hours with spare room, not in hours that are already full.
- Check whether a promotion or a new class shifts the pattern in the weeks after launch.
Libraries
For visitors: students and remote workers want a quiet seat. A library's forecast shows when it is calm, which for many branches is right after opening and in the evening.
For library teams:
- Put more staff at the help desk during the busiest hours, often late morning to mid-afternoon.
- Schedule workshops and events when patrons are already in the building.
- Compare branches across a city to see which ones are under pressure at which times.
Public libraries are public venues, so they are covered. A city can also publish quiet times for each branch on its website. See citizen apps for municipalities for more on that.
Retail stores
A retailer's own door counters only cover its own stores. Forecasts cover any public venue, including competitors and anchor stores in the same mall.
- Staffing. Schedule more people for peak hours and fewer in quiet ones.
- Opening hours. If the area is busy after you close, test staying open later. If your first hour is always near zero, consider opening later.
- Inventory. Restock before the days that rank highest in your week.
- Promotions. Run in-store events and offers in quiet hours to fill them.
- Site selection. Before you sign a lease, check when the neighbors are busy. A street that is packed at lunch but empty at 6 PM is a poor fit for an after-work concept.
- Chain comparison. Compare the weekly pattern of each of your locations and of competitor branches nearby.
For the analysis method, read foot traffic analysis.
Venues using dynamic pricing
Bars, restaurants, attractions and parking operators can price by hour. The forecast shows which hours need a reason to come in and which sell themselves.
- Quiet hours: happy hours, early-bird menus and off-peak tickets.
- Peak hours: full price, minimum spends or deposits for reservations.
- Platforms: a deals or reservations app can adjust offers automatically for each venue on its platform, based on that venue's forecast for the coming hours.
Start small. Test one quiet window, compare your sales for a few weeks, then extend.
Staffing agencies
Agencies that supply temporary staff to shops, restaurants, venues and events need to know when their clients will need people. Forecasts help in three ways:
- Predict demand per client location, using the client's own busy hours and peak days.
- Plan shift lengths around the peak, instead of fixed blocks that leave staff idle.
- Spot new demand, such as venues in an area that get busier on certain days.
Because the forecasts cover any public venue, an agency can run this for hundreds of client locations through the API.
Building managers and energy
Heating, ventilation and air conditioning work better when they follow occupancy. Busyness and CO2 levels tend to move together in busy buildings, so a forecast is a cheap signal for when to ramp up ventilation or start heating or cooling.
- Start the HVAC ramp-up before the forecast rise, so the building is comfortable when people arrive.
- Increase ventilation in the busiest hours.
- Turn down systems in hours that are always quiet.
This works for public buildings: malls, shops, museums, libraries, gyms and similar venues. BestTime does not forecast private offices, warehouses or other places the public does not visit. For those you need your own sensors.
Dating and social apps
Couples planning a first date want a place that is pleasant, not packed or empty. Social apps want to point people to where something is happening.
- Date planning. Suggest a restaurant that is calm at 7 PM for a first date, or a museum at a quiet hour for a daytime date.
- Lively spots. Show users which bars and cafes nearby are usually busy on a given evening, such as busy bars on a Monday night.
- Meeting points. Recommend a time when a chosen venue is likely to have free tables.
The API's Venue Filter returns venues in an area that match a day, an hour range and a busyness range, so an app can build these lists on the fly. The Venue Filter API tutorial shows how.
How to get the data
- Free city guides. Look up bars, restaurants, cafes, sightseeing spots and more per city, for example New York City. No account needed.
- Forecast tool and API. Create a free test account without a credit card. A new forecast by name and address costs 2 credits; a refresh or query by venue ID costs 1 credit.
- Paid plans. Basic Usage is $29 per month including 1,200 credits, then $0.04 per credit. For a fixed list of venues you check often, Pro Venues gives unlimited forecasts for a flat price: $96 per month for 50 venues, $119 for 100, $149 for 500 and $249 for 1,000. See pricing.
Limits to keep in mind
- Public venues only. BestTime forecasts places the public visits. It does not cover private workplaces, homes or closed sites.
- No head counts. The 0-100 score is relative to each venue's own busiest hour. It is not a visitor count and not a share of capacity.
- Not every venue has a forecast. Small or new venues may not have enough data yet.
- A forecast is a typical week. One-off events, closures and holidays can make a single day differ.
- Combine it with your own data. Sales, bookings and staffing records tell you how your business performs. The forecast tells you when people are around.
Next steps
- Learn the step-by-step method in foot traffic analysis.
- Compare data providers and prices in the foot traffic data guide.
- See how the 0-100 scale works in forecast venue busyness.
Questions
How can a small business use foot traffic data?
Use the hourly busyness forecast for your venue and the venues around you to plan staffing, opening hours, promotions and maintenance. Schedule more people for peak hours and move tasks and offers to quiet hours.
Can BestTime measure foot traffic in my office or warehouse?
No. BestTime forecasts public venues such as shops, restaurants, gyms, libraries, museums and malls. It does not cover private workplaces or homes.
Does BestTime tell me how many customers visited my store?
No. It returns a 0-100 busyness score per hour, relative to the venue's own busiest hour of the week. It does not return visitor counts.
BestTime in 47 seconds
See how busy any place gets, hour by hour
BestTime forecasts how busy a venue gets for every hour of the week, from anonymized, aggregated phone location data combined with weather, events and holidays. Look up one venue, compare a whole city, or use the API.
Try BestTime for free
Create a free account without a credit card, forecast a few venues you know, and see their busy and quiet hours for every day of the week.
Start free See pricing